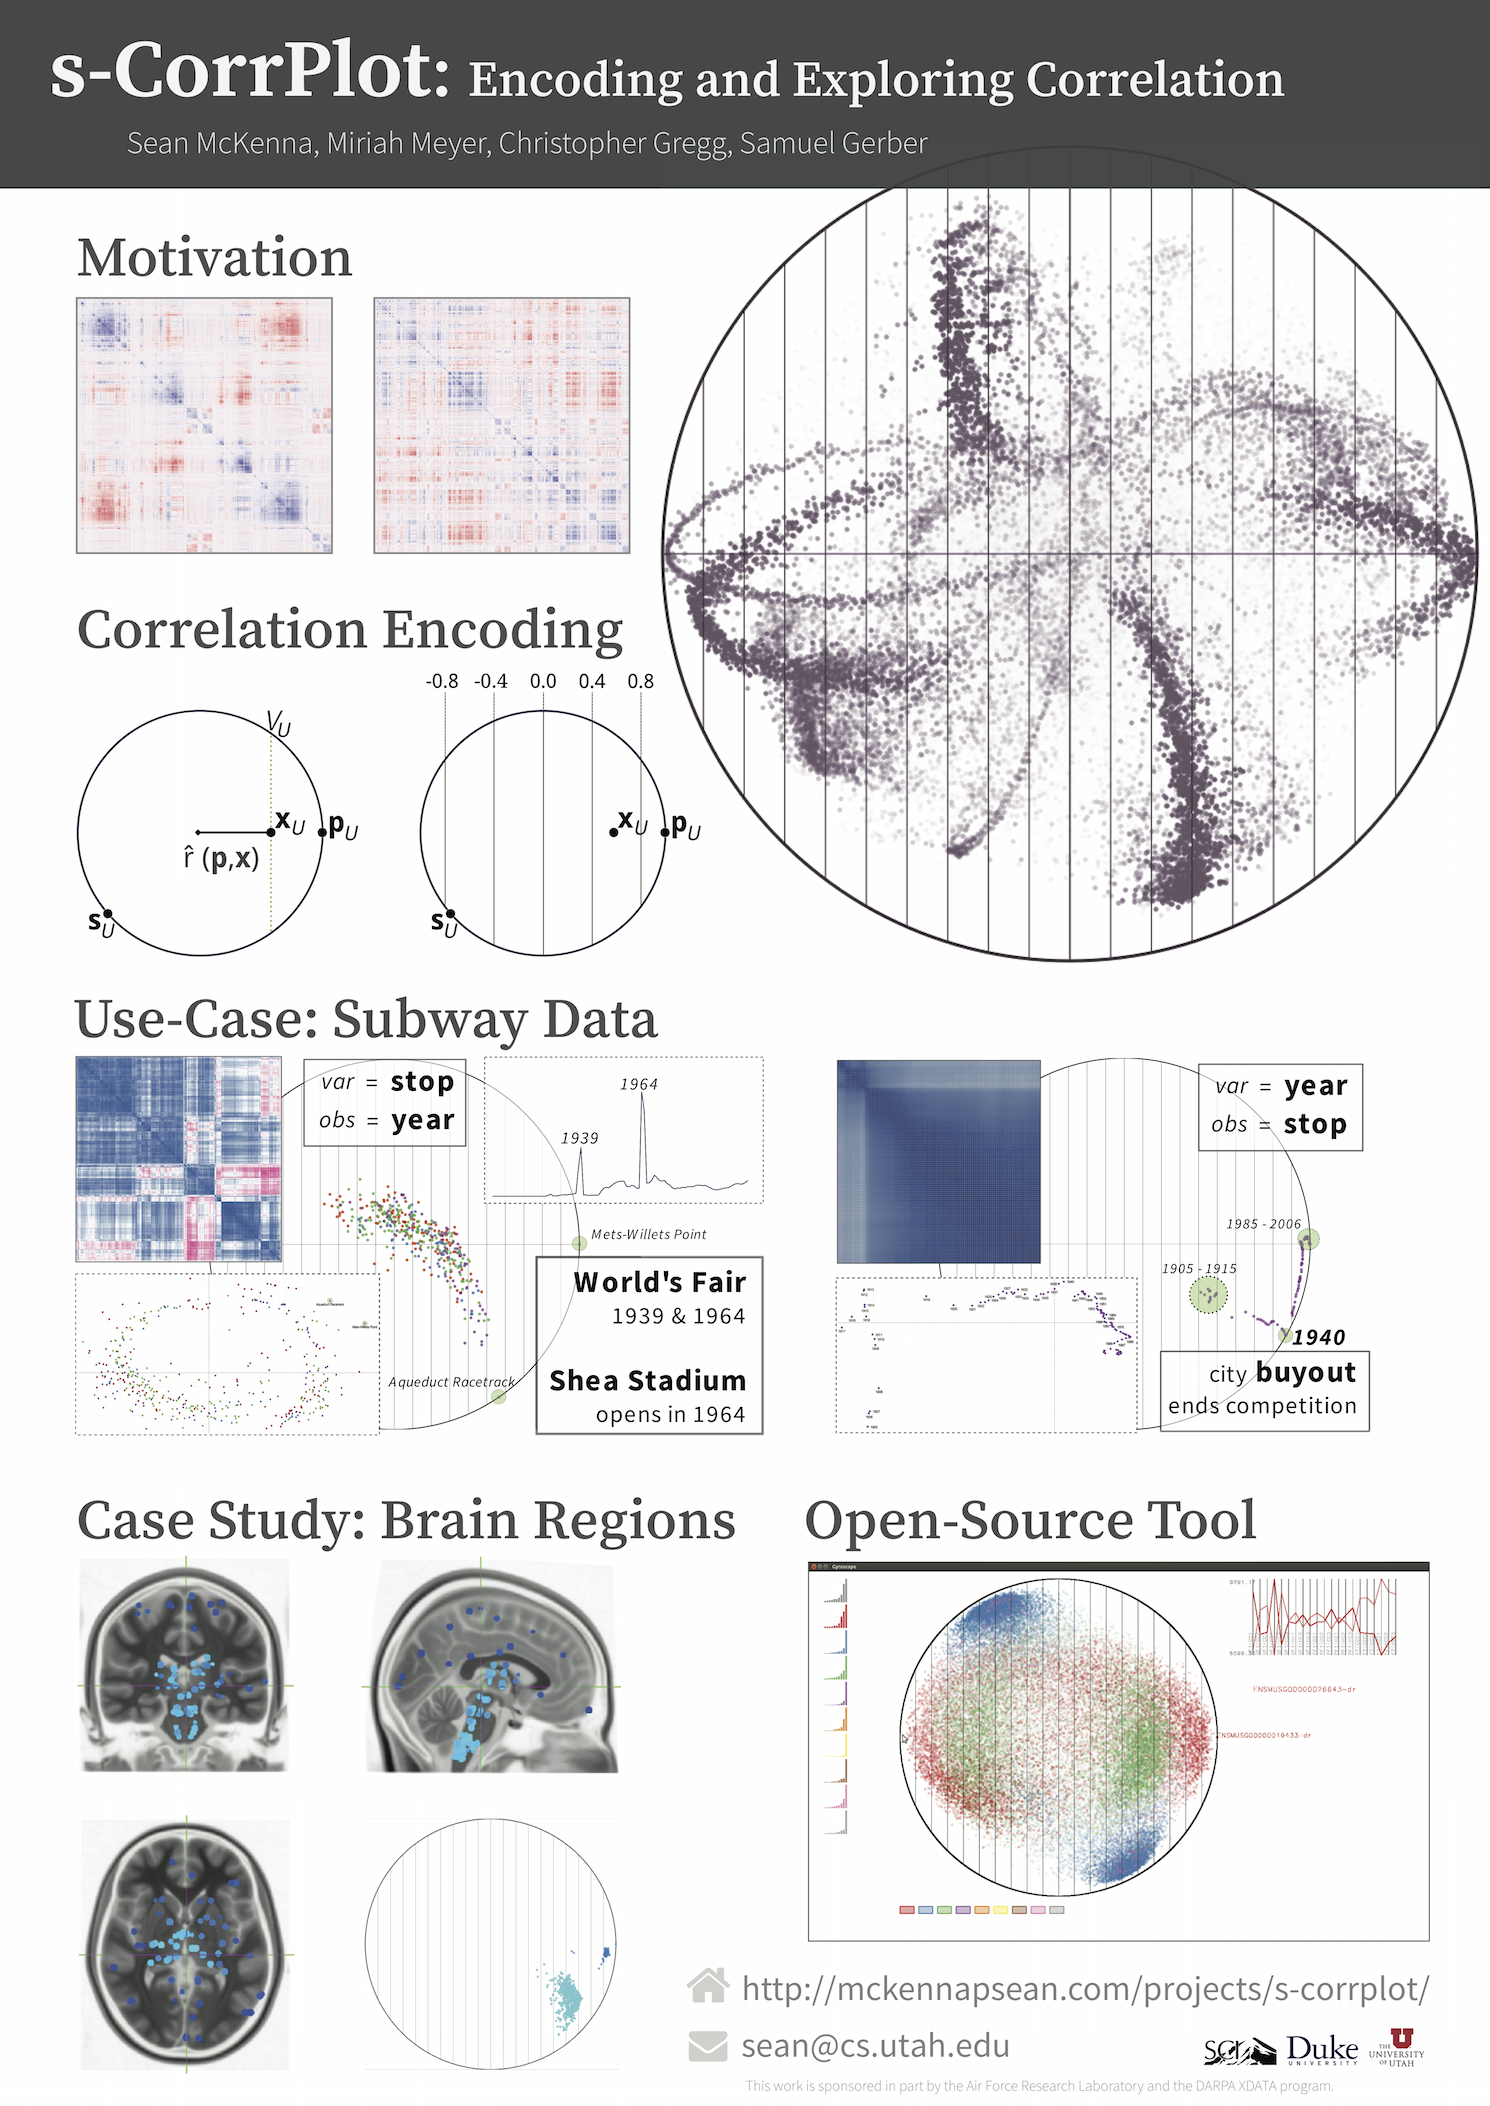
s-CorrPlot: visualizing correlation
by Sean McKenna, Miriah Meyer, Christopher Gregg, Samuel Gerber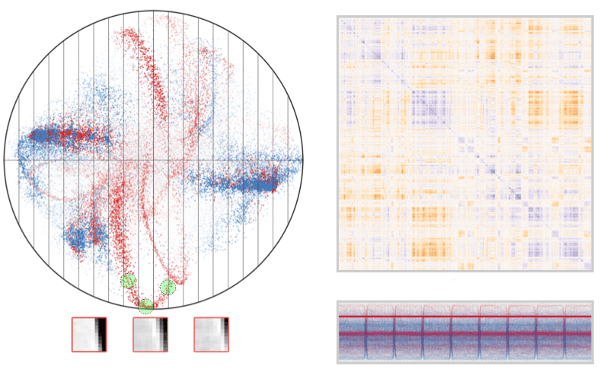
The s-CorrPlot is a new scatterplot for visually exploring pairwise correlation coefficients between all variables in large datasets.
The degree of correlation between variables is used in many data analysis applications as a key measure of interdependence. The most common techniques for exploratory analysis of pairwise correlation in multivariate datasets, like scatterplot matrices and clustered heatmaps, however, do not scale well to large datasets, either computationally or visually. We present a new visualization that is capable of encoding pairwise correlation between hundreds of thousands variables, called the s-CorrPlot. The s-CorrPlot encodes correlation spatially between variables as points on scatterplot using the geometric structure underlying Pearson's correlation. Furthermore, we extend the s-CorrPlot with interactive techniques that enable animation of the scatterplot to new projections of the correlation space, as illustrated in the companion video above. We provide the s-CorrPlot as an open-source R-package and validate its effectiveness through a variety of methods including a case study with a biology collaborator.
For further details, please read the description and derivation of the s-CorrPlot in our paper.